
Hello everyone!
I’ve made a little summary of the last five years. In this post, I will show you how the SpEFEKTETO portfolio packages performed, compared to the best benchmarks in the world.
As you know me, I don’t like to talk (write) much. So I’ll be loyal to my habit in this case too. My feelings are double, I could say that I laugh and cry at the same time. You’ll find out why if you keep reading.
Let’s first see the World benchmarks vs. Complex Portfolio of SpEFEKTETO.
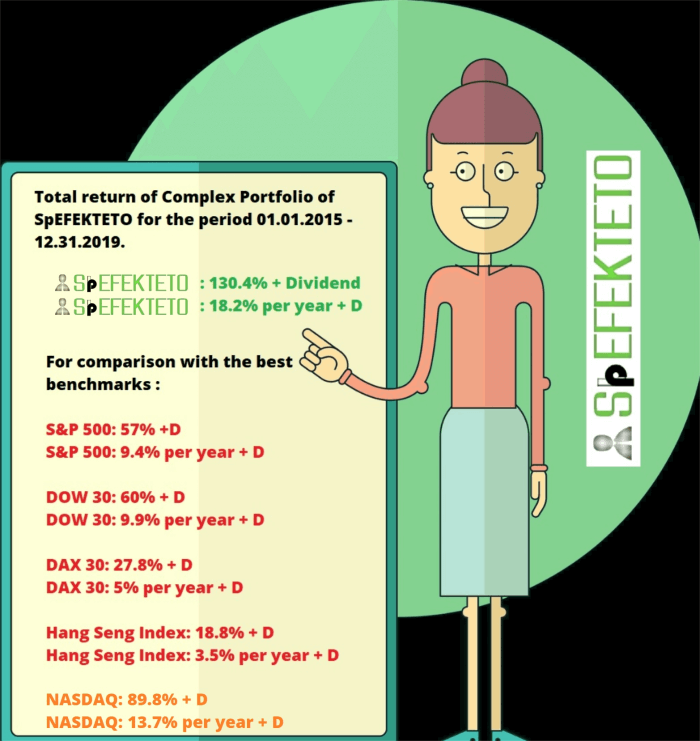
The complex portfolio performed very well. In fact, it exceeded my expectations and we were better than the best stock markets in the world. NASDAQ was the best performing stock market in the US for the last five years, but we managed to beat it by 40.6% (percentage points) . This represents an annual performance of 4.5% points more. Although I always consider the S&P 500 to be the main point of reference. SpEFEKTETO Complex Portfolio managed to beat S&P 500 by 73.4% points in five years. This represents an annual performance of 8.8% points more. Other Western European and Far Eastern markets have been far below this performance.
Complex Portfolio: 130.4% + Dividend in total
Complex Portfolio: 18.2% + D per annum
World benchmarks vs. Portfolio “B” and Portfolio “A” of SpEFEKTETO.
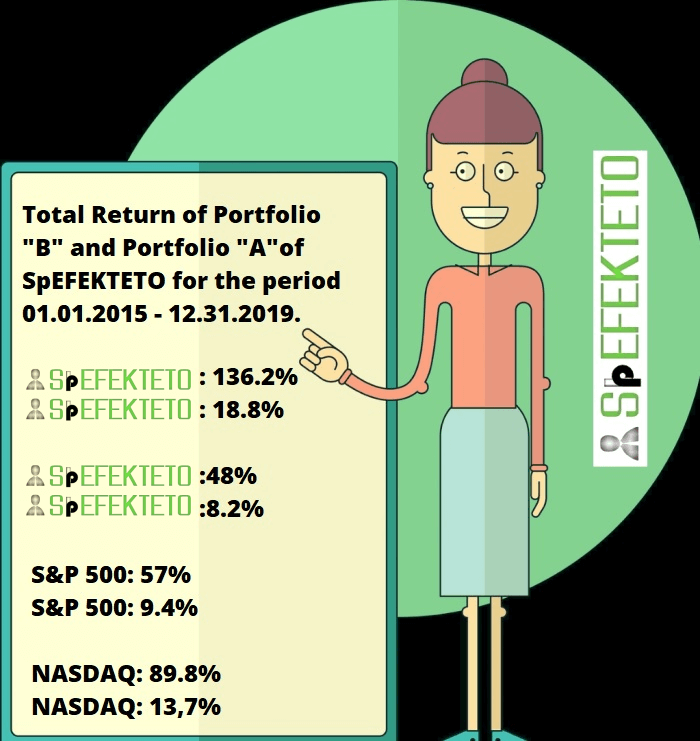
Unfortunately, Portfolio “B” and “A” have not met my expectations so far. We are nowhere near the 25% and 35% annual returns. Portfolio “B” still beat the Complex Portfolio, the NASDAQ and the S&P 500 by 5.8% points, 46.4% points and 79.2% points. This represents an annual performance of 0.6% points, 5.1% points and 9.4% points more.
Portfolio “B”: 136.2% in total
Portfolio “B”: 18.8% per annum
Portfolio “A” was beaten by the Complex Portfolio, the NASDAQ and the S&P 500 by 82.4% points, 41.8% points and 9% points. This represents an annual performance of 10% points, 5.5% points and 1.2% points more.
Portfolio “A”: 48% in total
Portfolio”A”: 8.2% per annum
I definitely need to improve in the future to reach the target of 25% and 35% a year.
Now let’s take a look at some of the best performing mutual funds in the past 5 years.
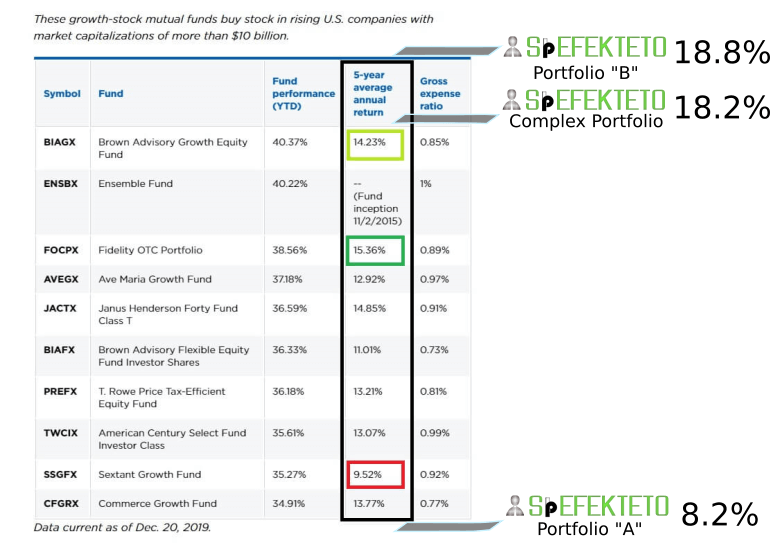
Source: www.nerdwallet.com
As you can see, we surround the field nicely. The SpEFEKTETO’s two portfolios also managed to beat the best equity fund, the Brown Advisory Growth Equity Fund. Portfolio B outperformed by 4.57% points and Complex Portfolio by 3.97% points. Although, according to my calculations, Brown Advisory Growth Equity Fund only achieved a 7.2% annual return between 2015 and 2019.
Let’s see another comparison!
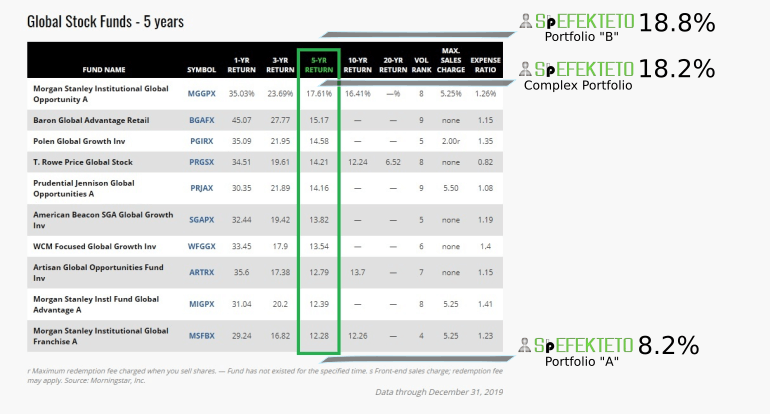
Source: www.kiplinger.com
The results are similar to the previous ones in terms of ranking. Morgan Stanley Institutional Global Opportunity “A” Fund has gained 17.61% annually over a 5-year horizon, which is below the performance of the “B” and the “Complex” portfolio by 1.19% points and 0.59% points.
In addition, it is important to mention that we have not had a loss since the launching year 2013. Note in the period 2013-2015 the portfolio selection system has evolved a lot so I expect our results from 2015 onwards.
Finally, let’s look at the performance of the world’s stock exchanges in 2019. Never have a worse year!
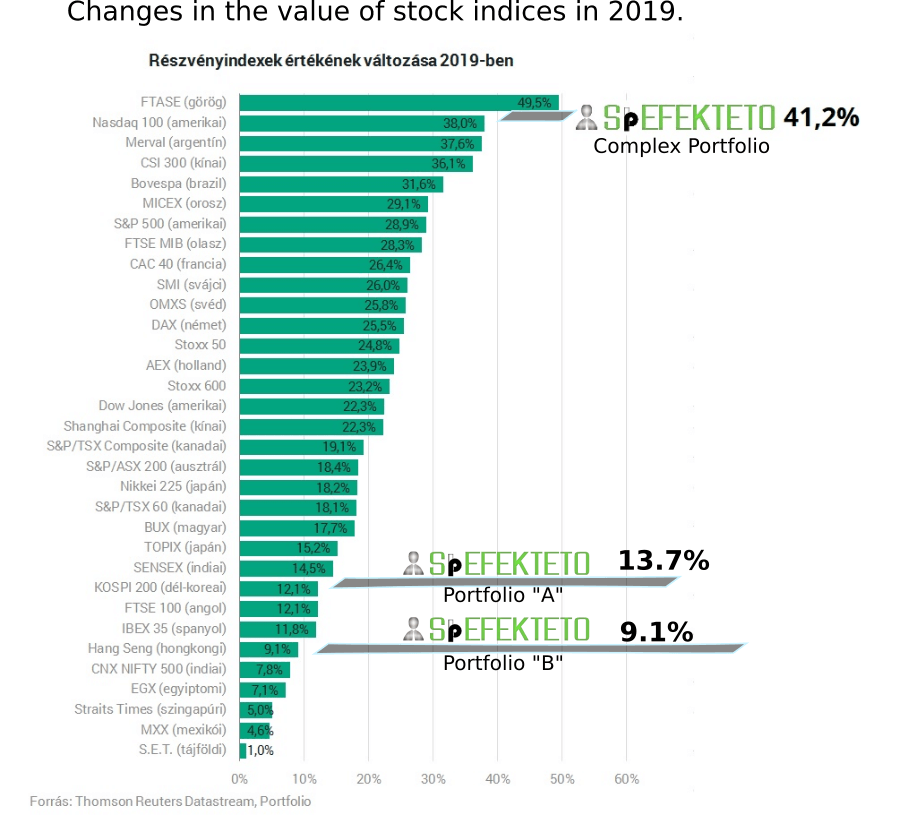
Source: Portfolio.hu online gazdasági újság
In summary, I am satisfied with my performance, that is, with our performance as you are also a part of this and enjoying the yields of SpEFEKTETO and I am looking forward to further improvement in the future, especially in the two split-portfolios. Don’forget to subscribe and comment!
Recent Comments