
Hello everyone! In 2015 I did six trades that I listed below, so you can see the results.
I am listing these companies according to the opening date.
Infosys Limited (INFY: NYSE) 2014.12.22 – 2015.01.27.
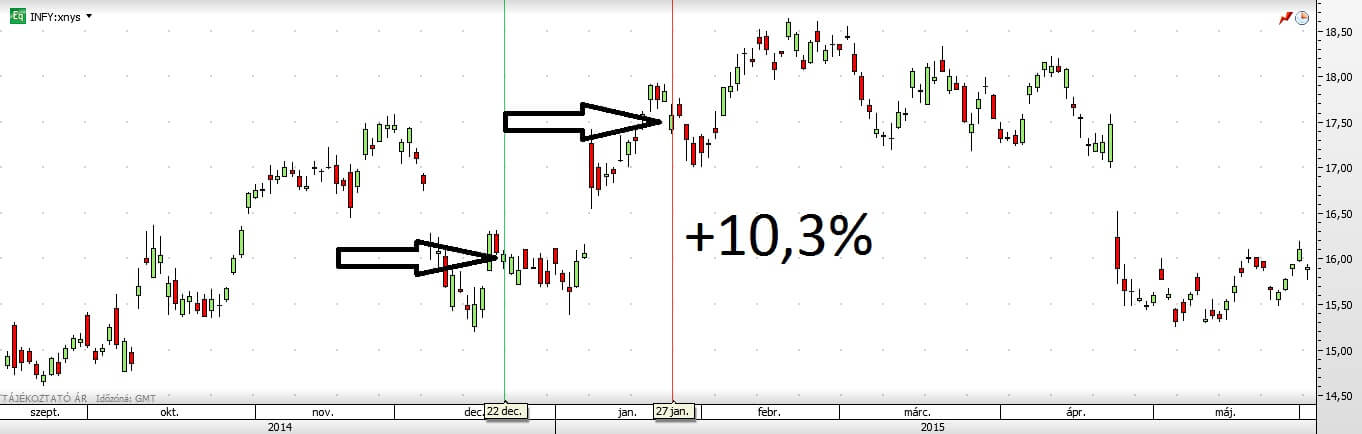
Opening price: 32 USD
Opening date: 2014.12.22.
Cost of transaction: 0,6%
Closing price: 35,49 USD
Closing date: 2015.01.27.
Result of the trade: +10,3%
NOTE: 2:1 split in 2015.
It was a smooth trade. Easy boarding, confirmed by the gap. After it reached the top I closed the position at market price.
Under Armour, Inc. (UA or UAA: NYSE) 2015.01.30 – 03.25.
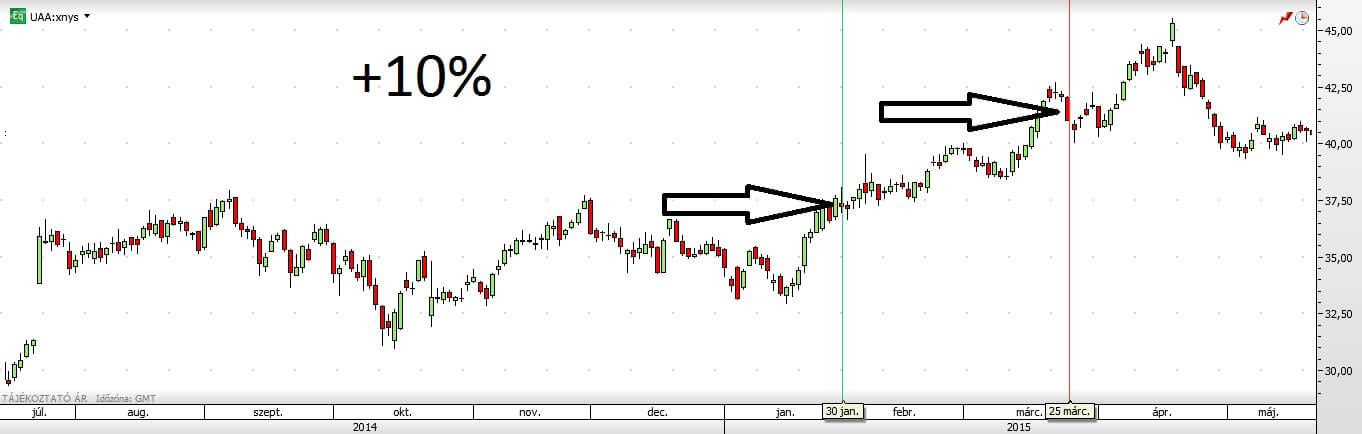
Opening price: 71,99 USD
Opening date: 2015.01.30.
Cost of transaction: 0,6%
Closing price: 79,6 USD
Closing date: 2015.03.25.
Result of the trade: +10%
NOTE: 2:1 split in 2016.
This was the double bottom formation trade when the trend was upwards. It is was pretty nice so I opened this position a bit early taking a little more risk but a I did it because the candle formation and the neckline formation was significant. The target price calculated from the formation also worked perfectly though the position was closed by the trailing stop order.
Simulations Plus, Inc. (SLP: NASDAQ) 2015.03.27 – 09.09.
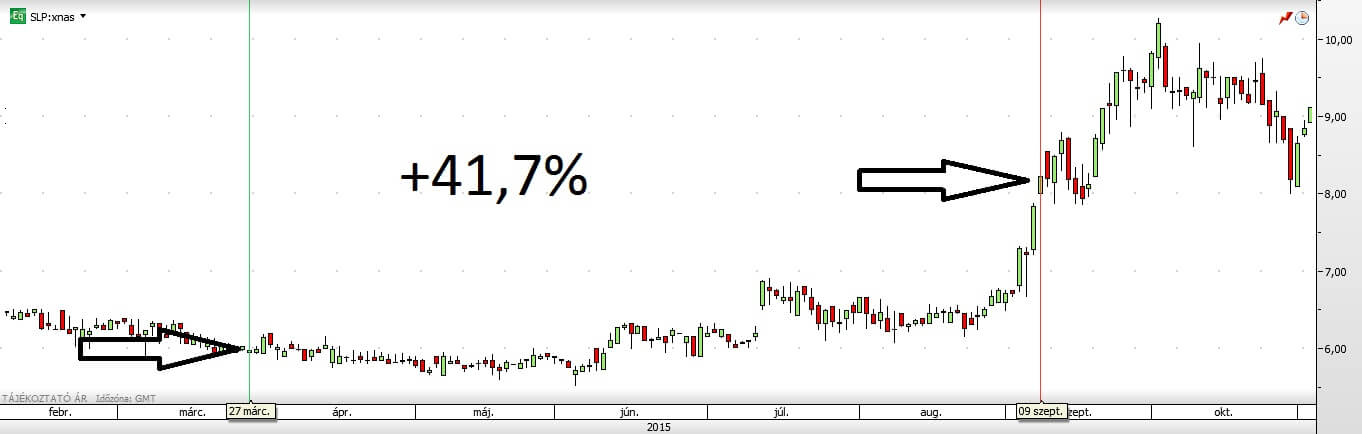
Opening price: 6,00 USD
Opening date: 2015.03.27.
Cost of transaction: 0,6%
Closing price: 8,54 USD
Closing date: 2015.09.09.
Result of the trade: +41,7%
SLP is relatively a small company, so the big potential in percent was given. It was a successful trade considering the percent performance of the company but It could have been more successful If I hadn’t set take profit order.
Monster Beverage Corporation (MNST: NASDAQ) 2015.03.27 – 05.11.
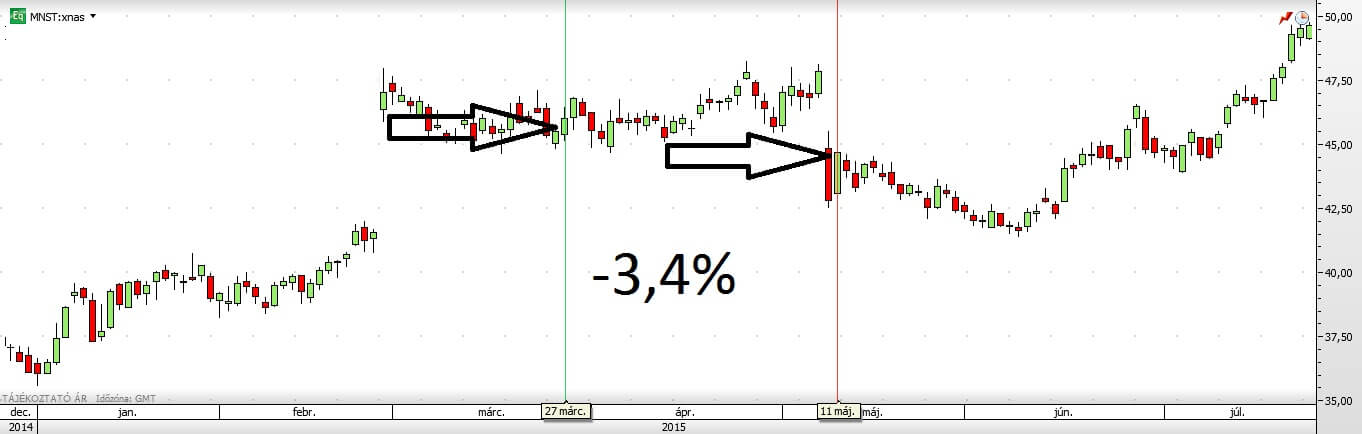
Opening price: 137,82 USD
Opening date: 2015.03.27.
Cost of transaction: 0,6%
Closing price: 133,96 USD
Closing date: 2015.05.11.
Result of the trade: -3,4%
NOTE: 3:1 split in 2016.
Monster was tricky at that time. After boarding I set a stop loss order because of the gap risk. Unfortunately that significant gap was doubled and the position was closed by me manually in order to minimalize the loss. Although the price didn’t reach the stop loss price yet, I thought the opportunity was gone. I was wrong.
Texas Instruments Incorporated (TXN: NASDAQ) 2015.07.29 – 12.18.
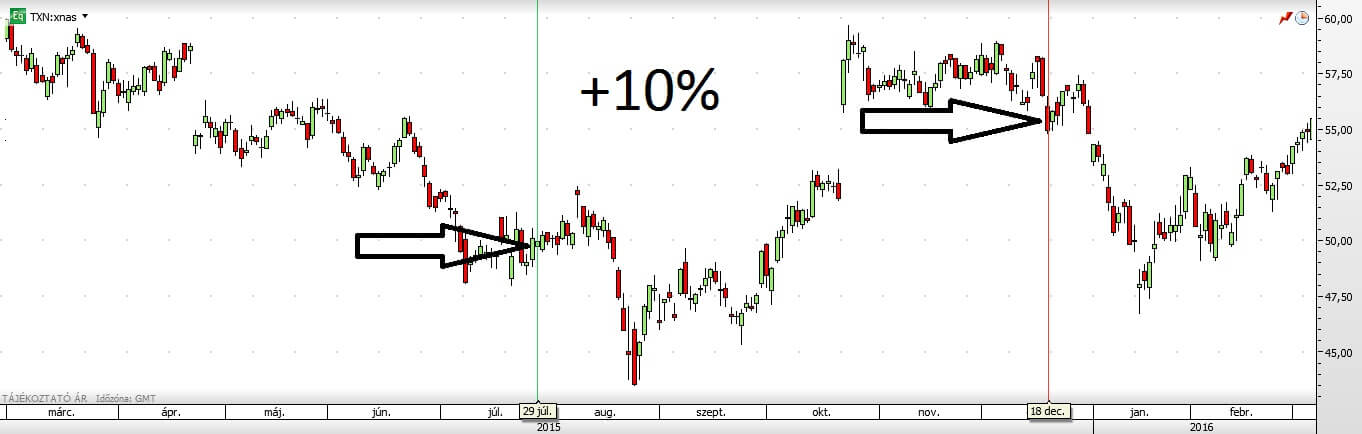
Opening price: 50,03 USD
Opening date: 2015.07.29.
Cost of transaction: 0,6%
Closing price: 55,33 USD
Closing date: 2015.12.18.
Result of the trade: +10%
The previous bottom of TXN was a bit far so I took a little more risk than average but otherwise the trade was smoothly. This position was closed by the stop loss order.
Apple Inc. (AAPL: NASDAQ) 2015.10.19 – 12.11.
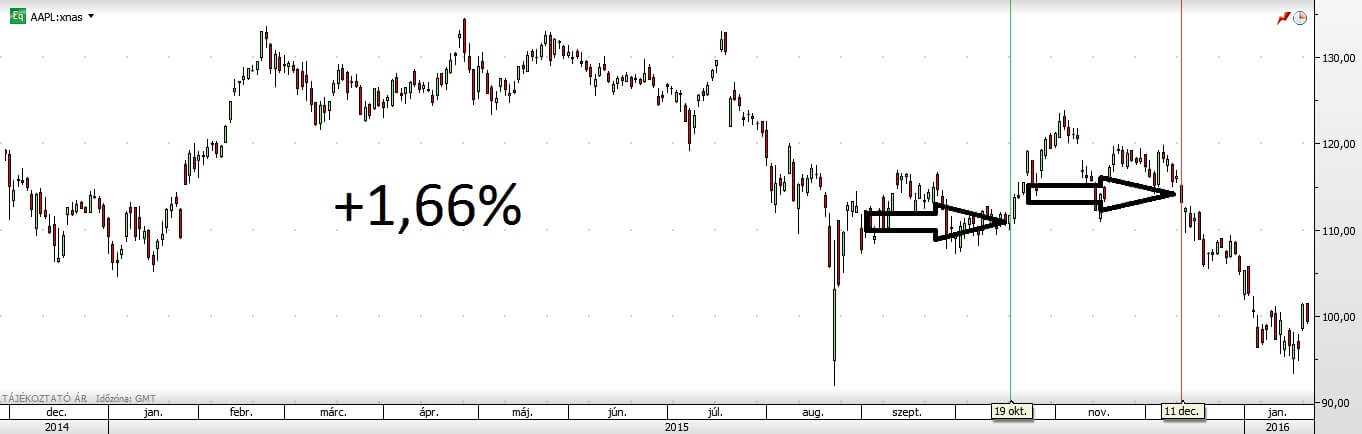
Opening price: 111,48 USD
Opening date: 2015.10.19.
Cost of transaction: 0,6%
Closing price: 114 USD
Closing date: 2015.12.11.
Result of the trade: +1,66%
AAPL was about the ignoring of the big green candle. I considered that as a noise on the chart but I shouldn’t have. In the end I managed closing the position by the stop loss order with positive result.
Recent Comments